ChatGPT is not the only large language model worth your attention. Over the past two years, a highly competitive field of alternatives has emerged – each with distinct strengths in reasoning, coding, real-time web access, cost, privacy, and multimodal capabilities. This guide compares the top ChatGPT alternatives across 8 dimensions so you can choose the right tool for your specific use case.
📌 How We Scored Each Tool: Each tool is evaluated across: Reasoning & Analysis · Creative Writing · Coding · Real-time Web Access · Multi-modal Vision · Safety & Alignment · Speed · Cost Efficiency. Scores are based on published benchmark results (MMLU, HumanEval, LMSYS Chatbot Arena), independent evaluations, and hands-on testing. ChatGPT (GPT-4o) is included as the reference baseline.
The Main ChatGPT Alternatives Compared in This Guide
Overall Score Leaderboard
Figure 1: ChatGPT Alternatives — Overall Score (out of 10) across Reasoning, Writing, Coding, Accuracy and Speed
Quick Comparison: All Top Alternatives at a Glance
🟠 Claude 3.5 Sonnet — Best for Writing and Analysis
Built by Anthropic with a focus on safety and helpfulness. Claude 3.5 Sonnet consistently tops independent writing and reasoning benchmarks. Its 200K token context window is the largest available in a mainstream consumer product, making it the best choice for processing long documents, legal texts, or research papers.
✅ Pros
❌ Cons
+ Largest context window of any mainstream model (200K tokens) + Top-rated for nuanced, long-form writing quality + Strong coding performance — near-equal to GPT-4o on HumanEval + Constitutional AI safety approach — fewer harmful outputs + Claude.ai web interface is clean and responsive
– No native real-time web search on free tier – Image generation not available – API pricing competitive but not the cheapest – Less integrated with third-party tools vs Copilot/Gemini – No persistent memory in standard deployment
🔵 Gemini 1.5 Pro — Best for Google Users and Multimodal Tasks
Google’s flagship model integrates natively with Gmail, Docs, Sheets, and Drive via Google Workspace. The 1 million token context window (Gemini 1.5 Pro) is the largest of any model in this list. It is the strongest tool for tasks that combine web search, image analysis, and document processing in a single workflow.
✅ Pros
❌ Cons
+ 1 million token context window — process entire codebases or book-length documents + Native integration with all Google Workspace apps + Real-time Google Search built into responses + Strong multimodal: image, video, audio and document understanding + Free tier is generous — Gemini 1.5 Flash is fast and free
– Reasoning still slightly behind Claude and GPT-4o on independent benchmarks – Creative writing quality rated lower than Claude by many users – Response accuracy can vary on highly specific technical questions – Gemini Advanced (paid) required for full capability access – Privacy implications for users in regulated industries
🐦 Grok-2 — Best for Real-Time and Unfiltered Responses
Grok is developed by xAI and has direct access to the X (Twitter) data firehose, making it uniquely capable at real-time social media trends, breaking news, and live market sentiment. It is also known for fewer content restrictions than most models — useful for edge-case creative tasks, though this comes with tradeoffs on safety guardrails.
✅ Pros
❌ Cons
+ Real-time access to X/Twitter data — unique capability no other model has + Fewer content restrictions — broader creative latitude + Competitive overall reasoning scores + Available free to X users (with rate limits) + Fun mode and unfiltered mode options
– Requires X Premium+ ($22/mo) for full access — most expensive on this list – Safety guardrails notably looser than Claude or Gemini – Not available via independent API without enterprise agreement – Quality varies more than Claude or GPT-4o across task types – Limited integration with external productivity tools
🔍 Perplexity AI — Best for Research with Cited Sources
Perplexity positions itself as an ‘answer engine’ rather than a chatbot. Every response includes inline citations to web sources, making it the most transparent and verifiable AI tool for research, fact-checking, and academic work. It is not the best for creative writing but is genuinely excellent at surfacing accurate, sourced answers.
✅ Pros
❌ Cons
+ Every answer includes cited web sources — highest factual verifiability + Real-time web search with clean, readable summaries + Academic and pro search modes with deeper research capabilities + Free tier is genuinely useful with web search included + Fastest tool for quick factual lookups with evidence
– Not designed for creative writing or long-form generation – Less capable at pure reasoning tasks vs Claude or Gemini – Pro subscription needed for advanced model selection – Less suitable for code generation or complex technical tasks – Not ideal for conversational or open-ended use cases
🦙 Llama 3.1 — Best Open-Source and Privacy-First Option
Meta’s Llama 3.1 (particularly the 405B parameter version) is the most capable openly available model — you can download the weights, run it on your own hardware, and use it with zero data leaving your infrastructure. For organisations with strict data privacy requirements, or developers who need to customise a model, Llama is in a category of its own.
✅ Pros
❌ Cons
+ Fully open weights — run locally with complete data privacy + No subscription fee — only infrastructure cost + Highly customisable — fine-tune on your own data + Available via many APIs (Together AI, Fireworks, Groq) at very low cost + Strong performance on benchmarks for a fully open model
– Requires significant compute to run the largest (405B) version locally – No native web search or real-time data without custom integration – User interface depends entirely on the platform you use it through – Requires technical setup for self-hosting — not plug-and-play – Smaller models (8B, 70B) significantly less capable than 405B
Pricing and Feature Availability
Figure 3: Monthly Pricing Comparison (Paid Plans) and Feature Availability Matrix by Tool
Tool
Free Tier Limits
Paid Plan
API Cost (approx.)
Best Value For
Claude (Anthropic)
Limited messages/day — claude.ai
$20/mo (Pro) — higher limits
$3–$15 per 1M tokens (input/output)
Developers needing large context + quality writing
Gemini (Google)
Gemini 1.5 Flash free; Pro limited
$20/mo (Advanced) — Workspace integration
$3.50–$10.50 per 1M tokens
Google Workspace users; multimodal workflows
Grok (xAI)
Free on X with rate limits
$22/mo (X Premium+)
No public API pricing (enterprise only)
X/Twitter users already paying X Premium
Copilot (Microsoft)
Free with Bing; limited GPT-4o access
$20/mo (Pro) — M365 integration
Via Azure OpenAI API pricing
Microsoft 365 users wanting AI in Office apps
Perplexity
Free with web search; limited Pro searches
$20/mo (Pro) — all models + deeper search
No standalone API
Researchers, journalists, fact-checkers
Llama 3.1 (Meta)
Fully free — download weights
Self-hosted (infrastructure cost only)
$0.20–$0.90 per 1M tokens (via Groq/Together)
Cost-sensitive teams; privacy-first orgs
Mistral Large 2
API credits only — no free chat
Pay-as-you-go API
$3 per 1M input tokens
EU-based companies needing data residency
DeepSeek V3
Free chat — deepseek.com
$8/mo or API pay-per-use
~$0.27 per 1M input tokens
Developers needing cheap, strong coding model
Table 2: ChatGPT Alternatives — Pricing, API Costs and Value Assessment
Which Tool Should You Use? Use Case Guide
Your Primary Use Case
Best Alternative
Why
Writing long documents, essays, reports
Claude 3.5 Sonnet
Best-rated writing quality; 200K context handles long docs natively
Coding and software development
Claude 3.5 Sonnet or DeepSeek V3
Claude tops HumanEval; DeepSeek V3 is strong at much lower API cost
Research with verifiable sources
Perplexity AI
Inline citations on every answer; real-time web; transparent sourcing
Google Workspace users (Gmail, Docs, Sheets)
Gemini Advanced
Native integration — AI in the apps you already use
Microsoft 365 users (Word, Excel, Teams, Outlook)
Microsoft Copilot Pro
Native M365 integration; GPT-4o powered; no context switching
Real-time news, social media analysis
Grok-2
Only model with live X/Twitter data access
Privacy-sensitive or air-gapped environments
Llama 3.1 (self-hosted)
Run completely locally; no data leaves your infrastructure
Low-cost developer API for high-volume tasks
DeepSeek V3 or Llama (Groq)
DeepSeek: ~$0.27/1M tokens; Groq Llama: among fastest + cheapest
EU data residency requirement
Mistral Large 2
French company; EU server options; GDPR-first design
Multilingual use (Asian languages focus)
Qwen 2.5 (Alibaba)
Strong Chinese, Japanese, Korean performance; open weights available
Image analysis and visual tasks
Gemini 1.5 Pro or GPT-4o
Both handle images, charts, PDFs and video natively
Business RAG (retrieval-augmented generation)
Cohere Command R+
Designed specifically for enterprise RAG and search applications
Table 3: Use Case Decision Guide — Best ChatGPT Alternative by Specific Need
Speed and Context Window Comparison
Figure 5: Context Window Size (tokens) and Output Speed (tokens/sec via API) — Key Technical Specs
Yes – several. Claude (claude.ai), Gemini (gemini.google.com), Perplexity (perplexity.ai), and Microsoft Copilot all offer free tiers with real capability. For fully open and unlimited use, Llama 3.1 weights are freely downloadable from Meta, and DeepSeek V3 offers a free chat interface with no subscription.
Which ChatGPT alternative is best for coding?
Claude 3.5 Sonnet and DeepSeek V3 are the strongest coding alternatives. Claude 3.5 Sonnet scores 92% on HumanEval (vs GPT-4o’s 90.2%). DeepSeek V3 matches that performance at a fraction of the API cost (~$0.27/1M input tokens vs Claude’s ~$3/1M). For zero-cost self-hosted coding assistance, Llama 3.1 405B via Groq is a strong option.
Is Claude better than ChatGPT?
It depends on the task. Claude 3.5 Sonnet outperforms GPT-4o on creative writing quality, long document processing (200K vs 128K context), and coding on some benchmarks. GPT-4o has a larger plugin and integration ecosystem and is more established across third-party tools. Most independent evaluators rate them as broadly equivalent, with Claude edging ahead on writing and nuanced reasoning.
Which AI has the largest context window?
Gemini 1.5 Pro has a 1 million token context window — the largest of any mainstream model covered here. Claude 3.5 Sonnet offers 200K tokens, and most other models (GPT-4o, Llama 3.1, Grok-2, Mistral) offer 128K tokens.
Are ChatGPT alternatives safe to use for business?
Safety depends on the deployment model, not the tool alone. For regulated industries: Claude (Anthropic’s enterprise API with data processing agreement), Microsoft Copilot (Microsoft 365 data compliance), and Cohere Command R+ (private deployment options) are the most commonly selected for enterprise compliance. For strict privacy, self-hosted Llama 3.1 or Mistral ensures data never leaves your infrastructure.
Which alternative is cheapest for API use?
DeepSeek V3 (~$0.27/1M input tokens) and Llama 3.1 via Groq (~$0.59/1M input tokens) are the cheapest high-quality options for API use. Claude 3.5 Sonnet ($3/1M input) and Gemini 1.5 Pro ($3.50/1M) are mid-range. GPT-4o ($5/1M) and Claude 3 Opus ($15/1M) are at the premium end.
Summary: The Right Alternative Depends on Your Use Case
If You Need…
Choose
Best overall writing quality
Claude 3.5 Sonnet
Best for Google Workspace + multimodal
Gemini 1.5 Pro
Best for Microsoft 365 integration
Microsoft Copilot Pro
Best for real-time web research with citations
Perplexity AI
Best for real-time social/news (X/Twitter data)
Grok-2
Best open-source / fully local / private
Llama 3.1 405B (self-hosted)
Best low-cost API for developers
DeepSeek V3 or Llama via Groq
Best for EU data residency
Mistral Large 2
Best for multilingual and Asian language tasks
Qwen 2.5
Best for enterprise RAG applications
Cohere Command R+
Table 5: Final Recommendation Summary — Best ChatGPT Alternative by Priority
💡 Bottom Line: No single alternative is best at everything. Claude 3.5 Sonnet leads for writing and analysis. Gemini leads for Google integration and multimodal. Llama and DeepSeek lead for cost and privacy. Pick based on your dominant use case — and note that using 2–3 tools for different tasks is a perfectly valid strategy.
The information and communications technology (ICT) sector accounts for an estimated 2–3% of global greenhouse gas emissions — broadly comparable to the aviation industry — and that share is growing as organisations digitalise faster than they decarbonise. According to the International Energy Agency (IEA), global data centres alone consumed approximately 200–250 TWh of electricity in 2022, and network infrastructure consumed a further 260–340 TWh.
Green IT — also called sustainable IT or eco-friendly computing — is a set of practices, policies, and procurement decisions that reduce the environmental impact of technology systems while, in many cases, also reducing operating costs. This guide covers what Green IT is, why it matters commercially, how to measure your current IT carbon footprint, and practical steps businesses of all sizes can take.
📌 Data Sources: Figures in this article are drawn from: IEA (World Energy Outlook 2023), Gartner IT Sustainability Reports, Uptime Institute Annual Data Centre Survey 2023, EPA ENERGY STAR, GeSI SMARTer2030 Report, Science Based Targets initiative (SBTi), and CDP Climate Disclosure Data. Sources are cited per section.
Green IT: Industry Key Statistics — ICT Energy Consumption, Cost and Efficiency Potential (Source: IEA 2023; Gartner; Uptime Institute)
What Is Green IT?
Green IT refers to the design, manufacture, use, and disposal of computers, servers, networking equipment, and associated systems in a manner that minimises environmental impact. It encompasses four lifecycle stages: manufacturing, operation, disposal, and the enabling of sustainability in other sectors through technology.
Green IT Dimension
What It Covers
Business Relevance
Energy-Efficient Hardware
Choosing equipment with lower power draw: servers, laptops, monitors, networking gear with ENERGY STAR or EPEAT ratings
Reduces electricity bills directly; typical server power optimisation saves 20–40% on energy spend
Data Centre Efficiency
Improving Power Usage Effectiveness (PUE), cooling systems, hot/cold aisle containment, and server utilisation rates
Average enterprise data centre operates at PUE 2.0; improving to 1.5 can halve cooling energy costs
Virtualisation and Cloud
Consolidating physical servers using virtualisation; migrating workloads to cloud providers with higher hardware utilisation
Server virtualisation typically reduces hardware count by 10:1; cloud migration can cut energy use by 65–80% per workload
Inefficient software can consume 10–100x more energy than well-optimised equivalents for the same task
Responsible E-waste Management
Extending device lifespan, donating or refurbishing equipment, using certified e-waste recyclers (e.g., R2, e-Stewards)
Global e-waste reached 62 million tonnes in 2022 (UN Global E-waste Monitor 2024); proper disposal avoids legal liability
Sustainable IT Procurement
Selecting suppliers with credible environmental policies; using eco-labels (EPEAT Gold, TCO Certified, ENERGY STAR)
Green procurement criteria increasingly required for government and enterprise supply chain compliance
Renewable Energy for IT
Powering data centres and offices with renewable electricity via Power Purchase Agreements (PPAs), RECs, or on-site generation
Major cloud providers — Google, Microsoft, Amazon — commit to 100% renewable matching; PPAs now accessible to mid-market firms
Table 1: Green IT Dimensions — Scope, Practices and Business Relevance
ICT Sector Carbon Footprint: The Scale of the Problem
Figure 1: Global ICT Sector CO₂ Emissions (Gigatonnes, 2015–2025 estimated) and Emissions by ICT Segment (Source: IEA World Energy Outlook 2023; GeSI SMARTer2030)
The ICT sector’s carbon footprint is distributed unevenly across its components. Data centres account for approximately 29% of ICT emissions, network infrastructure 26%, end-user devices 22%, hardware manufacturing 14%, and software and cloud services 9%, according to estimates compiled from IEA and GeSI research. These proportions vary by company type — a bank with large on-premise server infrastructure will have a different emission profile than a software company whose primary footprint is employee laptops.
Why Green IT Matters for Business: Commercial and Regulatory Drivers
Driver
Description
Trend
Energy Cost Reduction
IT infrastructure is one of the largest controllable operating costs for organisations. A 30–40% reduction in data centre energy spend is achievable with mature Green IT practices, translating to £100K–£5M+ in annual savings depending on scale.
Energy prices volatile; efficiency gains are permanent
Regulatory Compliance
The EU Corporate Sustainability Reporting Directive (CSRD) requires large companies to report Scope 1, 2, and 3 emissions from 2025. The SEC climate disclosure rules (USA, phased) and UK TCFD requirements create mandatory reporting obligations for public companies.
Mandatory for large firms; voluntary becoming expected for SMBs
Customer and Supply Chain Requirements
Large enterprises increasingly require suppliers to complete CDP questionnaires, meet Science Based Targets (SBT), or achieve ISO 14001 certification. Failing to do so can disqualify organisations from tenders.
Growing — particularly in financial services, retail, and automotive
Investor ESG Scrutiny
ESG-focused investors now manage over $35 trillion in assets globally (GSIA 2022). Poor environmental performance increases cost of capital and reduces access to ESG-indexed funds.
ESG integration accelerating; MSCI, FTSE Russell ESG indices now mainstream
Talent Attraction
A 2023 IBM Institute for Business Value survey found that 71% of employees prefer working for environmentally sustainable companies. IT professionals increasingly factor sustainability into employer choice.
Significant for engineering and technology talent acquisition
Carbon Taxes and Offset Costs
Carbon taxes now cover 23% of global emissions (World Bank Carbon Pricing Report 2023). Companies facing carbon taxes benefit directly from reducing IT energy consumption and associated emissions.
Expanding coverage; EU ETS prices have reached €60–€90/tonne
Table 2: Business Drivers for Green IT Adoption — Commercial, Regulatory and Reputational (Sources: CSRD; CDP; GSIA; IBM IBV 2023; World Bank)
The 6 Pillars of Green IT
Figure 2: The 6 Pillars of Green IT — Framework adapted from GeSI SMARTer2030 and Gartner IT Sustainability Maturity Model
Green IT Business Benefits: Impact and Cost Savings
Figure 3: Green IT vs Legacy IT — Business Impact Radar and Average Cost Savings by Practice Area (Source: Gartner; Uptime Institute; EPA ENERGY STAR programme data)
Organisations that have implemented mature Green IT programmes report measurable cost reductions across multiple categories. The figures in Figure 3 are averages drawn from Gartner’s IT Cost Optimisation benchmarks and Uptime Institute’s data centre efficiency reports. Individual results vary significantly based on starting infrastructure, industry, and programme scope.
Practical Green IT Practices: What to Do
1. Measure Your IT Carbon Footprint First
Before implementing Green IT practices, organisations need a baseline. The Greenhouse Gas Protocol (GHGP) provides the internationally recognised framework for measuring Scope 1 (direct), Scope 2 (purchased energy), and Scope 3 (value chain) emissions. For IT specifically, this involves auditing data centre energy use, employee device energy consumption, cloud provider emissions data, and hardware manufacturing footprints.
Measurement Tool / Standard
What It Covers
Access
GHG Protocol Corporate Standard
Framework for Scope 1, 2, 3 emissions calculation across all operations
Free — ghgprotocol.org
CDP Climate Questionnaire
Structured annual climate disclosure with IT emissions as a component
Required for major enterprise supply chain participation
Green Software Foundation Carbon Intensity API
Measures real-time carbon intensity of cloud compute by region
Open source — greensoftware.foundation
Cloud Carbon Footprint (open source tool)
Estimates cloud emissions across AWS, Azure, Google Cloud from billing data
Free — cloudcarbonfootprint.org
Uptime Institute PUE Calculator
Benchmarks data centre power efficiency against global norms
Free — uptimeinstitute.com
ISO 14064
International standard for quantifying and reporting GHG emissions
Auditable certification — ISO.org
Table 3: IT Carbon Footprint Measurement Tools and Standards (All sources publicly verifiable)
2. Data Centre Efficiency: Understanding PUE
Power Usage Effectiveness (PUE) is the primary metric for data centre energy efficiency. It is calculated as total facility energy divided by IT equipment energy. A PUE of 1.0 is perfect; most legacy enterprise data centres operate between 1.8 and 2.5, meaning 45–60% of energy is consumed by cooling, power conversion, and lighting rather than actual computing.
Figure 4: Data Centre PUE by Type (Lower is more efficient) and Renewable Energy Adoption by Industry Sector (Source: Uptime Institute Annual Survey 2023; IEA; company sustainability reports)
PUE Range
Rating
Typical For
Improvement Actions
1.0–1.2
Exceptional
Hyperscale cloud providers (Google avg 1.10, Microsoft avg 1.18)
Consider cloud migration or colocation; full infrastructure audit required
Table 4: Data Centre PUE Rating Scale — What Each Range Means and Priority Improvement Actions
3. Cloud Migration and Virtualisation
Migrating workloads from on-premise infrastructure to public cloud platforms is one of the highest-impact Green IT actions available to most organisations. A 2020 Accenture/WSP study found that migrating to the public cloud can reduce an organisation’s IT carbon footprint by up to 84% for equivalent workloads, primarily because hyperscale providers achieve much higher server utilisation rates (65–75% vs 15–20% for typical enterprise servers) and have larger renewable energy procurement programmes.
Cloud Provider
Renewable Energy Commitment
Carbon Neutrality Target
Data Source
Google Cloud
100% renewable matched since 2017; targeting 24/7 carbon-free by 2030
Carbon neutral since 2007; carbon-free operations by 2030
Google Environmental Report 2023
Microsoft Azure
100% renewable by 2025; 24/7 carbon-free by 2030 for all campuses
Carbon negative by 2030; remove historical carbon by 2050
Microsoft Environmental Sustainability Report 2023
Amazon AWS
100% renewable energy by 2025 (achieved ahead of schedule in 2023)
Net-zero carbon across operations by 2040
AWS Sustainability Report 2023
Google Cloud (Carbon Data)
Provides per-region carbon intensity data to customers
Region selection tool available in GCP console
Google Carbon Footprint Tool
Microsoft (Carbon Data)
Emissions Insights tool available in Azure portal for Scope 1/2/3
Customer scope 3 reporting in preview
Azure Sustainability Calculator
AWS (Carbon Data)
Customer Carbon Footprint Tool available in AWS Cost Explorer
Covers purchased electricity emissions per service
AWS Customer Carbon Footprint Tool
Table 5: Major Cloud Provider Renewable Energy Commitments and Customer Carbon Reporting Tools (Source: Provider Sustainability Reports 2023)
4. Sustainable Hardware Procurement
The manufacturing of IT hardware accounts for 70–80% of a device’s lifetime carbon footprint for laptops, and approximately 50% for servers. Extending device lifespans, selecting equipment with recognised eco-labels, and returning devices to manufacturer take-back schemes are practical ways to reduce hardware-related emissions.
Eco-Label / Standard
Scope
Key Criteria
Applicable Products
ENERGY STAR
Energy efficiency in use
Meets EPA energy consumption thresholds for each product category
PCs, laptops, monitors, servers, printers, data centre equipment
Criteria across 8 environmental categories: materials, energy, end of life
PCs, tablets, mobile phones, servers, imaging equipment
TCO Certified
Comprehensive — people, planet, society
Covers chemical restrictions, display quality, ergonomics, factory conditions
Laptops, desktops, monitors, headsets, displays
EU Ecodesign Regulation
Energy and circularity for EU-sold products
Minimum energy efficiency; repairability; spare parts availability (7 years)
Servers (from 2025); displays; network equipment
ISO 14001
Environmental management system
Organisation-level standard for environmental management processes
Supplier qualification — not product-specific
R2 / e-Stewards Certification
Responsible electronics recycling
Standards for safe, traceable, responsible e-waste handling
E-waste recyclers and refurbishers — supply chain qualification
Table 6: IT Eco-Labels and Standards — Scope, Criteria and Applicable Product Categories
5. Green Software Engineering
Software efficiency is an emerging but increasingly important dimension of Green IT. The Green Software Foundation — a Linux Foundation project backed by Accenture, GitHub, Microsoft, and others — defines green software as software that is carbon-efficient, energy-efficient, and hardware-efficient. Their Green Software Practitioner course and Software Carbon Intensity (SCI) specification provide a framework for developers to measure and reduce the carbon impact of code.
Green Software Practice
What It Involves
Estimated Impact
Optimise compute intensity
Profile and refactor code to reduce unnecessary processing cycles
10–70% reduction in CPU utilisation for same output in well-optimised cases
Workload time-shifting
Schedule batch compute during low-carbon-intensity grid periods (e.g. daytime solar hours)
15–30% reduction in carbon intensity for batch workloads with no change to output
Select carbon-efficient cloud regions
Deploy in cloud regions powered by higher proportions of renewable energy
Up to 40x difference in carbon intensity between highest and lowest carbon cloud regions (Google Carbon Data)
Retire legacy applications
Identify and decommission applications with low or zero utilisation
Unused servers often consume 25–60% of peak power even idle (Dell/EPA research)
Reduce data transfer
Compress assets, use CDNs, reduce API payload sizes, use efficient protocols
Network data transfer accounts for a measurable share of end-user device energy; compression reduces this proportionally
Right-size cloud resources
Match cloud instance size to actual workload; use auto-scaling
Cloud resource over-provisioning is a documented problem — AWS estimates 30–40% of cloud spend is wasted
Table 7: Green Software Engineering Practices — Methods and Estimated Carbon/Energy Impact
6. E-waste Management
The United Nations University Global E-waste Monitor 2024 reported that 62 million tonnes of e-waste were generated globally in 2022, with only 22.3% documented as formally collected and recycled. For organisations, responsible e-waste management involves: extending device lifespans, using manufacturer take-back programmes, donating functional equipment to schools and charities, and contracting R2 or e-Stewards certified recyclers for end-of-life processing.
Green IT Implementation Roadmap
Figure 5: Green IT 18-Month Implementation Roadmap — Phase Sequencing from Audit to Continuous Improvement
Phase
Timeline
Key Activities
Expected Outcome
Phase 1: Audit and Baseline
Months 1–3
Inventory all IT assets; measure energy consumption; calculate current IT carbon footprint using GHG Protocol; establish KPIs
Documented baseline; Scope 1, 2, 3 IT emissions quantified; priority areas identified
Phase 2: Quick Wins
Months 2–6
Power management settings on all devices; decommission unused servers; LED lighting in server rooms; optimise cooling setpoints; virtualise underutilised servers
Typical 10–20% energy reduction achievable within 6 months with minimal capital spend
Phase 3: Infrastructure Upgrade
Months 5–9
Server refresh to energy-efficient models; hot/cold aisle containment; UPS upgrade; PUE improvement programme; network equipment rationalisation
PUE improvement from >2.0 towards 1.5–1.7 range; measurable kWh reduction
Set up CDP reporting; prepare CSRD/TCFD disclosures; obtain ISO 14001 or equivalent if required; communicate progress to stakeholders
Regulatory compliance achieved; investor and customer-facing reporting in place
Phase 7: Continuous Improvement
Month 13 onwards
Integrate carbon metrics into IT procurement; set Science Based Targets for IT; automate carbon reporting; run annual Green IT review cycle
Programme becomes embedded; targets aligned with SBTi or equivalent science-based framework
Table 8: Green IT 18-Month Implementation Roadmap — Phases, Activities and Outcomes
Relevant Standards, Frameworks and Reporting Requirements
Standard / Framework
Issuing Body
What It Requires
Who It Applies To
GHG Protocol Corporate Standard
World Resources Institute (WRI) / WBCSD
Scope 1, 2, 3 emissions calculation and reporting methodology
Voluntary; underpins most mandatory frameworks
EU Corporate Sustainability Reporting Directive (CSRD)
European Commission
Mandatory climate-related disclosures including IT energy and emissions data from FY2024 (large listed companies); FY2025 onwards for large private companies
Large EU-based companies and non-EU companies with significant EU revenue
Task Force on Climate-related Financial Disclosures (TCFD)
Financial Stability Board
Climate risk governance, strategy, risk management, and metrics/targets including ICT-related risks
Mandatory for UK listed companies; increasingly adopted globally
Science Based Targets initiative (SBTi)
CDP / WWF / WRI / UN Global Compact
Corporate emissions reduction targets aligned with 1.5°C Paris Agreement pathway
Voluntary commitment; increasingly expected by investors and large corporate customers
ISO 14001
International Organisation for Standardisation
Environmental Management System (EMS) certification covering all aspects of environmental impact
Often required in supplier qualification; auditable certification
EU Ecodesign for Sustainable Products Regulation (ESPR)
European Commission
Minimum design requirements for energy efficiency, repairability, and recyclability of IT products sold in EU
IT hardware manufacturers and EU market participants
Green Software Foundation SCI Specification
Green Software Foundation (Linux Foundation project)
Software Carbon Intensity (SCI) metric for measuring software carbon footprint
Software developers and technology teams seeking to quantify code carbon impact
Table 9: Green IT Regulatory Frameworks and Voluntary Standards — Scope and Applicability
Key Metrics to Track in a Green IT Programme
Metric
Definition
Target / Benchmark
Data Source
Power Usage Effectiveness (PUE)
Total facility power ÷ IT equipment power. Lower is better.
Best practice: <1.5; hyperscale: <1.2
Data centre power management system; smart PDUs
Carbon Usage Effectiveness (CUE)
Total CO₂ emissions from data centre ÷ IT equipment energy. Lower is better.
Target: <0.4 kg CO₂/kWh for renewable-powered facilities
Energy supplier invoice + IEA grid carbon intensity data
Server Utilisation Rate
% of CPU and memory capacity in active use on average
Best practice: >65%; many enterprise servers run at 15–25%
Table 10: Green IT Key Performance Metrics — Definition, Target and Data Source
Frequently Asked Questions
Frequently Asked Question
Expert Answer
What is Green IT in simple terms?
Green IT means using, buying, and disposing of technology in ways that reduce environmental harm — primarily by consuming less energy, generating less e-waste, and sourcing electricity from renewable sources. It covers everything from data centres to employee laptops to how code is written.
Is Green IT expensive to implement?
Many Green IT actions reduce costs rather than increase them. Power management settings, server virtualisation, and cloud right-sizing typically reduce operating expenses. Higher-cost actions — such as data centre infrastructure upgrades or renewable energy PPAs — require capital investment but usually have positive ROI within 2–5 years. The EU Commission estimates organisations that implement Green IT best practices can reduce IT energy costs by 30–40%.
What is a good PUE for a data centre?
The Uptime Institute reports an average global PUE of 1.58 for 2022. A PUE below 1.5 is considered efficient; below 1.2 is exceptional and characteristic of hyperscale cloud providers. Legacy enterprise data centres often operate above 2.0, meaning more than half of energy is consumed by cooling and power conversion rather than computing.
Do businesses have to report IT carbon emissions?
Requirements vary by jurisdiction and company size. EU companies subject to the CSRD must report Scope 1, 2, and 3 emissions — which include IT — from FY2024 or FY2025 depending on company size. UK-listed companies must comply with TCFD requirements. US public companies face SEC climate disclosure rules (phased implementation). Many companies face informal requirements through customer and investor questionnaires even where regulatory mandates do not yet apply.
What is the difference between Scope 1, 2, and 3 emissions for IT?
Scope 1: Direct emissions from company-owned generator fuel. Scope 2: Indirect emissions from purchased electricity (data centres, offices). Scope 3: All other indirect emissions — including cloud service provider emissions (upstream), hardware manufacturing (upstream), and employee device use at home (downstream). For most IT organisations, Scope 2 is the largest category, but Scope 3 hardware manufacturing can be significant for device-heavy businesses.
What is the Green Software Foundation?
The Green Software Foundation is a non-profit Linux Foundation project — members include Accenture, GitHub, Microsoft, and others — focused on reducing the carbon emissions of software. It publishes the Software Carbon Intensity (SCI) specification for measuring software carbon footprint and provides a free Green Software Practitioner certification course at learn.greensoftware.foundation.
Summary: Getting Started with Green IT
Green IT is not a single project — it is an ongoing operational discipline that touches procurement, infrastructure, software development, and supplier management. The most practical starting point for most organisations is a baseline carbon audit using the GHG Protocol, followed by the quick wins that reduce energy consumption without significant capital spend: power management, server virtualisation, and retiring unused infrastructure.
Priority
Action
Typical Effort
Expected Benefit
Start here
Conduct IT carbon baseline audit using GHG Protocol or equivalent
2–6 weeks with existing team
Identifies where emissions and energy costs are concentrated
Quick win
Enable power management on all desktops, monitors, and servers
1–2 days via IT policy / endpoint management tool
5–15% reduction in device and server energy consumption
Quick win
Decommission servers with <10% CPU utilisation
1–4 weeks audit + migration
Each decommissioned server saves ~500–1,500 kWh per year
India’s information technology industry is one of the most remarkable economic success stories of the modern era. From a modest beginning providing low-cost software services in the 1990s, the Indian IT sector has grown into a global powerhouse generating over $254 billion in annual export revenue, employing 5.4 million technology professionals, and competing with — and frequently beating — global technology giants for the world’s most complex enterprise transformation engagements.
This comprehensive ranking evaluates India’s top IT companies by global revenue, workforce scale, service specialisation, geographic reach, financial strength, and analyst positioning — giving you the most complete picture of the Indian IT landscape available.
Industry Overview: India’s Top IT Companies — Key Industry Statistics (NASSCOM, Company Annual Reports)
Why Indian IT Companies Dominate Global Technology Services
The dominance of Indian IT companies in global technology services is not accidental — it is the result of four structural advantages that have compounded over three decades: an unmatched pipeline of STEM graduates, a cost-quality ratio that Western alternatives cannot replicate, English-language fluency across the talent base, and a time-zone that enables round-the-clock delivery for clients in the Americas and Europe.
Structural Advantage
India’s Position
Global Impact
STEM Graduate Pipeline
India produces 2.5M+ engineering graduates annually — more than USA and Europe combined
Largest English-speaking technology talent pool in the world
Cost Competitiveness
Indian IT salaries are 5-8x lower than US equivalents for comparable skills
Enables 40-60% cost reduction for clients vs on-shore delivery
English Language Proficiency
India has the world’s second-largest English-speaking population (125M+ speakers)
Zero language barrier for US, UK, Australian, and Canadian clients
Time Zone Advantage
IST (UTC+5:30) enables real-time overlap with US afternoons and European mornings
Follow-the-sun delivery model gives 20-24hr development cycles
Process Maturity
Indian IT firms pioneered the Capability Maturity Model (CMM) — industry gold standard
Highest concentration of CMM Level 5 certified organisations globally
Domain Depth
30+ years of BFSI, healthcare, retail, and manufacturing project experience
Institutional knowledge across every major industry vertical
Government Support
NASSCOM, SEZs (Special Economic Zones), and PLI schemes support sector growth
Favourable tax and regulatory environment for IT exports
Table 1: Why Indian IT Companies Lead Global Technology Services — 7 Structural Advantages
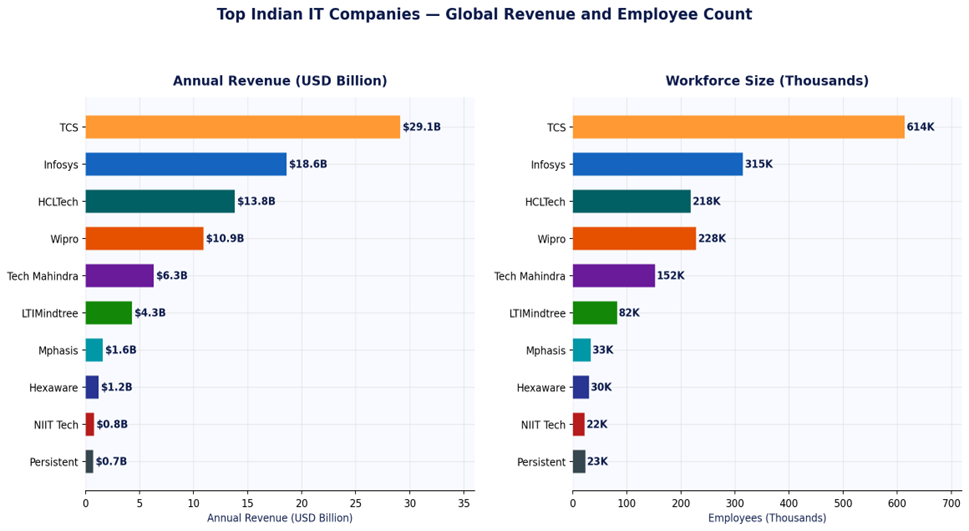
Top Indian IT Companies — Revenue and Workforce
Figure 1: Top 10 Indian IT Companies — Annual Revenue (USD Billion) and Employee Count
Top 10 Indian IT Companies Ranked by Global Revenue
Rank
Company
Revenue
Employees
HQ
Key Strength
Gartner/Analyst Position
1
Tata Consultancy Services (TCS)
$29.1B
614,000
Mumbai
Largest scale + client loyalty
Leader — Magic Quadrant IT Services
2
Infosys
$18.6B
315,000
Bengaluru
Digital transformation + AI
Leader — Magic Quadrant IT Services
3
HCL Technologies
$13.8B
218,000
Noida
Engineering services + products
Challenger — MQ IT Services
4
Wipro
$10.9B
228,000
Bengaluru
Consulting + cloud services
Challenger — MQ IT Services
5
Tech Mahindra
$6.3B
152,000
Pune
Telecom + 5G + BPO
Strong in Telecom segment
6
LTIMindtree
$4.3B
82,000
Mumbai
Data analytics + engineering
Emerging challenger
7
Mphasis
$1.6B
33,000
Bengaluru
BFSI + cloud platforms
Niche player — BFSI
8
Hexaware Technologies
$1.2B
30,000
Mumbai
Automation + AI-led delivery
Niche player — automation
9
NIIT Technologies
$0.8B
22,000
Noida
Travel + BFSI + government
Niche verticals
10
Persistent Systems
$0.7B
23,000
Pune
Software engineering + ISV
Fast-growing mid-tier
Table 2: Top 10 Indian IT Companies — Revenue, Workforce, Headquarters and Market Position
Revenue Growth and Market Share
Figure 2: Top 4 Indian IT Companies — Market Share Distribution and Revenue Growth Trajectory
Deep Dive: Top 5 Indian IT Companies
1. Tata Consultancy Services (TCS) — India’s IT Crown Jewel
TCS is not just India’s largest IT company — it is one of the world’s most valuable IT services organisations by market capitalisation, consistently valued above $170 billion. The company’s scale, client loyalty (it counts 57 clients generating over $100M annually), and operational efficiency set it apart in the global IT landscape.
✅ Pros
❌ Cons
+ Largest Indian IT company by revenue ($29.1B) and employees (614K) + Industry-leading client retention — 57 clients with $100M + annual TCS revenue + Consistent net profit margins of ~19-20% — among the best in sector + Strong presence across all major industries and geographies + TCS BaNCS, TCS iON — proprietary products adding recurring revenue + Lowest attrition rate in the industry at ~12.5%
– Revenue growth has moderated — single-digit growth in recent quarters – Perceived as conservative in acquisitions vs Infosys and Wipro – Heavy dependence on North America (55%+ of revenue) – Scale creates some organisational inertia for rapid pivots – Premium pricing vs smaller Indian IT players
2. Infosys — The Digital Transformation Leader
Infosys has successfully repositioned from a traditional IT services company to a digital transformation leader. Its Infosys Cobalt (cloud services), Infosys Topaz (AI services), and Living Labs platform have attracted premium-rate digital engagements that consistently drive higher revenue per employee than TCS or Wipro.
✅ Pros
❌ Cons
+ Highest revenue per employee ($59K) — reflects premium digital positioning + Cobalt (cloud) and Topaz (AI) platforms drive premium-priced engagements + Strongest net profit margin in tier-1 Indian IT at 21.4% + Most diversified client base — 1,800+ active clients across all industries + Infosys Institute thought leadership builds brand premium globally
– Smaller workforce than TCS — scale limits pursuit of very large deals – Historical management instability has occasionally disrupted execution – Revenue growth slower than aspirational targets in recent periods – Less diversified geographically than TCS or Wipro – Wage inflation pressure from talent competition with global tech giants
3. HCL Technologies — The Engineering Services Specialist
HCL Technologies has carved a distinctive position through its engineering services and software products business — a segment that commands higher margins and greater client stickiness than traditional IT outsourcing. Its Mode 3 strategy (products and platforms) generates recurring licence revenue that differentiates it from peers.
✅ Pros
❌ Cons
+ Strong engineering services — highest specialisation in industrial/manufacturing + HCLSoftware products division provides recurring revenue and higher margins + Fastest-growing tier-1 Indian IT company for several consecutive years + Strong in ADM (Application Development and Maintenance) — sticky, recurring work + Growing cloud services practice with differentiated engineering-led approach
– Products business not yet at the revenue scale to dramatically reshape financials – Geography concentration risk — North America and Europe dominate – Less known brand globally vs TCS and Infosys — affects senior hiring – Relatively newer to pure-play digital transformation vs Infosys – Integration of acquired software assets (IBM Software) still maturing
Service Mix and Geographic Revenue
Figure 3: Indian IT Companies — Service Line Mix and Geographic Revenue Distribution (% of Revenue)
Financial Comparison: All Top 5
Metric
TCS
Infosys
HCLTech
Wipro
Tech Mahindra
Revenue (USD)
$29.1B
$18.6B
$13.8B
$10.9B
$6.3B
Net Profit Margin
19.8%
21.4%
15.8%
16.2%
5.4%
Revenue per Employee
$47K
$59K
$63K
$48K
$41K
YoY Revenue Growth
4.4%
1.4%
5.4%
-1.0%
4.0%
Attrition Rate
12.5%
14.2%
12.8%
17.8%
18.2%
Digital Revenue %
~52%
~62%
~60%
~58%
~55%
Market Cap (approx)
$170B+
$75B+
$55B+
$25B+
$7B+
Clients (active)
1,400+
1,800+
1,000+
1,200+
700+
Countries Served
50+
50+
60+
65+
90+
Gartner Position
Leader
Leader
Challenger
Challenger
Challenger
Table 3: Top 5 Indian IT Companies — Full Financial and Operational Comparison
The Next Tier: Rising Indian IT Champions
Company
Revenue
Specialisation
Key Differentiator
Growth Trajectory
LTIMindtree
$4.3B
Data, cloud, engineering
Post-merger scale; Mindtree’s digital + LTI’s legacy strength
Strong — 15%+ organic growth in recent years
Mphasis
$1.6B
BFSI + cloud
Blackstone backing; AI-led mortgage and banking tech
Solid — BFSI exposure drives premium rates
Hexaware
$1.2B
Automation + AI delivery
Automation-first delivery model; returning to public markets
Re-emerging — IPO potential driving investment
Persistent Systems
$0.7B
Software engineering + ISV
Fastest-growing mid-tier; strong with software product companies
Unique automotive software + EV focus; high growth
High — EV wave drives strong demand for KPIT
Sonata Software
$0.3B
Microsoft ecosystem + retail
Deep Microsoft Gold partnership; modernisation-led GTM
Growing — cloud modernisation demand strong
Table 4: Rising Indian IT Champions — The Next Tier Companies to Watch
Indian IT Industry: Key Statistics
Metric
Figure
Context
Total IT Export Revenue
$254B+
India accounts for ~32% of global IT services exports
Domestic IT Revenue
$52B+
Rapidly growing domestic market driven by digital India
Total IT Workforce
5.4M+
Largest technology workforce of any country outside China
IT as % of GDP
10%+
IT sector is a structural pillar of the Indian economy
Annual Engineering Graduates
2.5M+
More engineering graduates than USA, Europe, and China combined
Fortune 500 Clients
All 500
Every Fortune 500 company is a client of at least one Indian IT firm
NASSCOM Members
3,000+
Broad ecosystem of product, services and startup companies
R&D Investment
$7B+/yr
Growing investment in IP and product development
Table 5: Indian IT Industry Key Statistics — Scale, Revenue and Workforce Data
Frequently Asked Questions
Frequently Asked Question
Expert Answer
Which is the largest Indian IT company?
TCS (Tata Consultancy Services) is the largest Indian IT company by revenue ($29.1B), market capitalisation ($170B+), and employee count (614,000+). It is also one of the most valuable IT services companies in the world.
Which Indian IT company is most profitable?
Infosys consistently achieves the highest net profit margin among tier-1 Indian IT companies at around 21-22%, reflecting its premium digital positioning and higher revenue per employee ($59K vs TCS’s $47K).
How do Indian IT companies compare to global peers like Accenture?
Accenture ($64B revenue) and IBM ($60B) exceed the largest Indian IT companies in revenue, but Indian IT firms compete fiercely in IT services and digital transformation — and often win on quality-to-cost ratio. TCS, Infosys, and HCLTech regularly beat global peers in Gartner rankings for specific service categories.
Are Indian IT companies good investments?
TCS and Infosys are among India’s most widely held institutional stocks and have delivered strong long-term returns. However, the sector faces headwinds including wage inflation, AI-driven efficiency gains reducing headcount needs, and slowing enterprise IT budgets. Always consult a financial advisor before investing.
What is NASSCOM?
NASSCOM (National Association of Software and Service Companies) is the apex industry body for India’s IT and BPM sector. It represents 3,000+ companies, publishes annual sector data, and advocates for industry-friendly policy with the Indian government.
Which Indian IT company is best for freshers?
TCS is the largest recruiter of fresh engineering graduates in India, hiring 35,000-50,000 freshers annually through its National Qualifier Test (NQT). Infosys, Wipro, and HCLTech also run large campus recruitment programmes. All four offer structured fresher training programmes (TCS Xplore, Infosys InfyTQ).
Conclusion: The Future of Indian IT on the Global Stage
Indian IT companies are no longer just cost-efficient outsourcing partners — they are strategic transformation partners for the world’s largest enterprises. The shift from labour arbitrage to intellectual capital is already underway: Infosys Topaz, TCS’s proprietary platforms, and HCL’s engineering products demonstrate that India’s IT companies are building IP, not just services.
TCS: Safe choice for scale, reliability, and long-term enterprise partnership
Infosys: Best for digital transformation, AI, and cloud-led engagements
HCLTech: Top choice for engineering services and software product companies
Wipro: Strong for consulting-led transformation and infrastructure services
The next wave — LTIMindtree, Persistent, KPIT — offers specialised depth with high growth potential
Key Takeaway: India’s IT industry is not finished growing. With AI, cloud, and engineering services as new growth vectors, and a domestic market accelerating rapidly, the top Indian IT companies are positioned for their next decade of global expansion.
Choosing between Salesforce and Microsoft Dynamics 365 is the defining CRM decision for most large enterprises in 2026. Both platforms have passed the $7 billion annual revenue mark, both have embedded generative AI into every module, and both can scale to tens of thousands of users globally. Yet they serve fundamentally different organisational profiles — and choosing the wrong one costs millions.
This head-to-head comparison covers pricing, AI capabilities, integration depth, implementation timelines, total cost of ownership, and the specific company profiles that make one platform clearly better than the other.
💡 Quick Verdict: Salesforce wins on AI depth, ecosystem size and feature breadth. Dynamics 365 wins on Microsoft integration, value for Microsoft-first organisations, and Copilot AI. Neither is universally better — your existing tech stack is the primary decision factor.
Market Position & Revenue 2025
Understanding each vendor’s market position reveals their investment priorities, support capacity, and long-term viability as your CRM partner.
Figure 1: Salesforce vs MS Dynamics 365 — Revenue and Feature Dimension Scores 2025
Platform Overview
Dimension
Salesforce Sales Cloud
Microsoft Dynamics 365 Sales
Founded
1999
2016 (rebranded from Dynamics CRM)
Annual CRM Revenue
$34.9B (total)
$7.8B (est. Dynamics)
Global CRM Market Share
23.8%
5.3%
Active Enterprise Customers
150,000+
295,000+ (incl. SMB)
AI Engine
Einstein AI + Agentforce
Microsoft Copilot (GPT-4o)
AppExchange/Marketplace
8,000+ apps
3,200+ apps (AppSource)
Gartner Magic Quadrant
Leader (2024/2025)
Leader (2024/2025)
G2 Score (Enterprise)
8.2/10
8.0/10
Starting Enterprise Price
$165/user/month
$115/user/month
Avg Implementation (Enterprise)
3-9 months
3-8 months
Table 1: Salesforce vs Microsoft Dynamics 365 — Side-by-Side Platform Overview
Feature-by-Feature Comparison
Figure 2: Salesforce vs MS Dynamics 365 — Feature Capability Radar (Score /10, 2025)
AI Capabilities: Einstein vs Copilot
AI is now the central differentiator in enterprise CRM. Both Salesforce and Microsoft have invested billions in making AI a native part of their platforms.
AI Feature
Salesforce Einstein + Agentforce
MS Dynamics 365 Copilot
Generative AI
✅ Einstein Copilot + Agentforce agents
✅ Copilot for Sales (GPT-4o powered)
Lead Scoring
✅ Predictive AI scoring
✅ Predictive lead scoring
Email Drafting
✅ Einstein email generation
✅ Copilot email drafts in Outlook
Call Summaries
✅ Einstein Conversation Insights
✅ Copilot call recording + summary
Autonomous Agents
✅ Agentforce (unique capability)
⚡ Copilot Studio (limited agents)
Data Enrichment
✅ Data Cloud integration
✅ LinkedIn Sales Navigator (native)
Forecasting AI
✅ Einstein Forecasting
✅ Predictive forecasting
Extra AI Cost
Add-on pricing for advanced AI
Mostly included in E5 licence
Table 2: AI Feature Comparison — Salesforce Einstein vs Microsoft Dynamics Copilot (2025)
Pros and Cons
Salesforce — Pros & Cons
✅ Pros
❌ Cons
+ World’s largest CRM ecosystem — 8,000 + AppExchange apps + Einstein Agentforce: most advanced autonomous AI agents + Superior configurability for complex multi-cloud deployments + Industry clouds for 12 + verticals with pre-built data models + Gold-standard training platform (Trailhead) with 50M + learners
– Highest TCO: implementation + licence often 3-5x sticker price – Complex admin — most enterprises need a dedicated Salesforce admin – AI features (Agentforce, Data Cloud) are expensive add-ons – Steep learning curve for non-technical business users – Licence sprawl: most capabilities are separate paid modules
Microsoft Dynamics 365 — Pros & Cons
✅ Pros
❌ Cons
+ Native integration with Teams, Outlook, Azure, Power BI, SharePoint + Copilot AI (GPT-4o) built into every module at low additional cost + Lower TCO for Microsoft-first organisations with E5 licensing + Power Platform (low-code) extends CRM without developer dependency + LinkedIn Sales Navigator integration is unique to Microsoft
– CRM-only product is weaker than Salesforce outside Microsoft ecosystem – AppSource marketplace significantly smaller than Salesforce AppExchange – UI inconsistency across Dynamics 365 apps (different design languages) – Requires Microsoft partner for enterprise deployment — quality varies – Customisation beyond standard workflows needs Azure developer skills
Pricing & Total Cost of Ownership
Figure 3: Salesforce vs Dynamics 365 — Pricing and Customer Satisfaction Scores (2025)
Cost Component
Salesforce Enterprise
MS Dynamics 365 Enterprise
Base Licence (per user/mo)
$165 (Sales Enterprise)
$115 (Dynamics 365 Sales)
Marketing Module
$1,250/mo (Marketing Cloud Growth)
$1,500/mo (Customer Insights)
Service Module
$150/user/mo (Service Cloud)
$115/user/mo (Dynamics CS)
AI Add-ons
$50-$75/user/mo (Einstein/Agentforce)
Mostly included in E5 licence
Implementation (500 users)
$800K – $2.5M
$500K – $1.8M
Annual Support (Premium)
$30,000 – $100,000
$20,000 – $60,000
Est. 3-Year TCO (500 users)
$4.5M – $9M
$3M – $6.5M
Data Storage Included
10GB + 20MB/user
10GB + 5MB/user
Table 3: Salesforce vs Dynamics 365 — Complete Pricing and TCO Breakdown (500-User Enterprise)
When to Choose Salesforce vs Dynamics 365
Choose Salesforce If…
Choose Dynamics 365 If…
You need the most advanced AI and autonomous agents (Agentforce)
Your organisation runs Microsoft 365 and Azure as primary stack
You require multi-cloud: Sales + Service + Marketing + Commerce + Analytics
You want Copilot AI deeply embedded in Teams, Outlook and SharePoint
You operate across 50+ countries with complex regulatory requirements
You have existing Microsoft E5 licences — Dynamics licences can be bundled
You need the largest partner and app ecosystem globally
You want lower implementation and ongoing admin costs
Your industry is heavily served by Salesforce (retail, financial services, media)
Your industry uses LinkedIn heavily — native Sales Navigator integration
ROI is measured in years — you can invest in a full platform build
You need faster time-to-value — Dynamics deploys faster in Microsoft environments
Table 4: Decision Framework — When to Choose Salesforce vs Microsoft Dynamics 365
Frequently Asked Questions
Frequently Asked Question
Expert Answer
Is Salesforce better than Dynamics 365 in 2025?
Salesforce leads in AI depth, ecosystem size, and global enterprise features. Dynamics 365 leads in value for Microsoft-stack organisations and Copilot AI accessibility. Neither is universally better — the right choice depends on your tech stack and budget.
Can Dynamics 365 replace Salesforce?
For Microsoft-first organisations, yes — Dynamics 365 can handle most CRM requirements while offering better integration and lower cost. For companies needing Agentforce AI, multi-cloud CRM, or the broadest app ecosystem, Salesforce remains superior.
What is the price difference between Salesforce and Dynamics?
Salesforce Enterprise starts at $165/user/month vs Dynamics 365 Sales at $115/user/month. However, total 3-year TCO for 500 users is typically $4.5-9M for Salesforce vs $3-6.5M for Dynamics 365.
Does Dynamics 365 work with Salesforce?
Yes — via middleware such as Boomi, MuleSoft, or Microsoft Azure Logic Apps. However, running both simultaneously is expensive and creates data sync complexity. Most enterprises choose one platform.
Which has better AI — Salesforce or Dynamics?
Salesforce Einstein Agentforce offers more advanced autonomous agent capabilities. Microsoft Copilot offers deeper integration with Microsoft 365 tools and is more accessible for non-technical users. Both are genuinely competitive in 2025.
How long does implementation take?
Salesforce Enterprise: 3-9 months. Dynamics 365 Enterprise: 3-8 months. Timeline is driven by data migration complexity, custom workflows, and integrations — not the platform itself.
Conclusion: Salesforce vs Dynamics 365 — The Verdict
The Salesforce vs Microsoft Dynamics 365 decision comes down to one core question: is your organisation Microsoft-first or platform-agnostic?
Microsoft-first organisations (Office 365, Azure, Teams as primary tools) should choose Dynamics 365 — lower TCO, native Copilot AI, and seamless productivity integration.
Platform-agnostic enterprises needing the deepest AI, largest ecosystem, and global multi-cloud capability should choose Salesforce.
Companies with less than 500 users should seriously evaluate HubSpot Enterprise before committing to either platform’s enterprise pricing.
🚀 Next Step: Request a 30-day proof-of-concept from both vendors using your own data, your actual use cases, and involvement from your IT, sales, and marketing teams. Never sign a multi-year enterprise CRM contract based on a demo alone.
Choosing the right enterprise CRM software is one of the most consequential technology decisions a large organisation will make. With the global CRM market projected to surpass $157 billion by 2030 and AI rewriting every aspect of customer engagement, the stakes have never been higher — or the options more complex.
This comprehensive guide ranks and compares the 10 best enterprise CRM platforms for large companies in 2026. Every platform has been evaluated across 50+ criteria including AI capabilities, implementation timeline, total cost of ownership, Gartner Peer Insights ratings, G2 user scores, integration depth, and analyst positioning.
💡 Quick Answer: If you need one recommendation — Salesforce Sales Cloud for global enterprises with complex needs, Microsoft Dynamics 365 for Microsoft-heavy organisations, or HubSpot Enterprise for the best user experience and fastest ROI.
What Is Enterprise CRM Software?
Enterprise CRM (Customer Relationship Management) software is a platform designed for large organisations — typically with 250+ users, multi-country operations, or complex sales cycles — that need deep customisation, robust security, and seamless integration with ERP, marketing automation, and service management systems.
Unlike SMB CRM tools, enterprise platforms offer:
Role-based access control (RBAC) and SSO/SAML security
API-first architecture for deep ERP and supply chain integration
AI-powered forecasting, lead scoring and next-best-action automation
Multi-currency, multi-language, multi-entity support for global teams
Custom objects, workflows and approval chains without code limits
SLAs guaranteeing 99.9%+ uptime with dedicated enterprise support
Enterprise CRM Market Landscape 2025
The enterprise CRM market is dominated by a handful of global players, yet no single vendor holds majority share. Understanding market position helps you assess vendor viability, support quality, and ecosystem depth.
Figure 1: Enterprise CRM Market Share and Annual Revenue — Global 2025 (Sources: IDC, Gartner, Statista)
Salesforce holds a 23.8% share of the global CRM market — more than the next four competitors combined. However, for enterprise buyers, market share alone is not the decision driver. Integration fit, implementation partner ecosystem, and total cost of ownership are equally critical factors.
Top 10 Enterprise CRM Platforms Ranked for 2026
The table below presents our ranked list of the best enterprise CRM software for large companies, incorporating Gartner Peer Insights, G2 scores, analyst positioning, and real-world implementation data.
SI No
CRM Platform
Best For
Price/User/Mo
Gartner
G2
KD
Ideal Company Profile
1
Salesforce Sales Cloud
Overall Leader
$165
4.4/5
8.2/10
62
Global enterprises needing full-suite CRM + AI
2
Microsoft Dynamics 365
Microsoft-stack orgs
$115
4.3/5
8.0/10
56
Companies embedded in Microsoft 365 ecosystem
3
Oracle CX Cloud
Data-heavy industries
$110
4.1/5
7.6/10
50
Finance, telecom, utilities with complex data
4
SAP CRM / C/4HANA
Manufacturing & ERP
$130
4.0/5
7.4/10
52
SAP ERP shops needing native CRM integration
5
HubSpot Enterprise
Ease of use + Support
$150
4.5/5
8.8/10
54
Mid-to-large companies prioritising UX & speed
6
Zoho CRM Plus
Value for money
$57
4.2/5
8.1/10
48
Cost-conscious enterprises needing depth
7
Creatio CRM
No-code customisation
$25
4.4/5
8.4/10
38
Ops teams wanting process automation without dev
8
Pega CRM
Decision automation
Custom
4.1/5
7.8/10
44
Regulated industries: insurance, banking
9
SugarCRM Sell
Open-source flexibility
$80
4.0/5
7.5/10
40
Tech-savvy teams needing deep customisation
10
Freshsales Enterprise
Fast implementation
$69
4.3/5
8.5/10
42
Growing companies needing quick ROI in < 60 days
Table 1: Top 10 Enterprise CRM Platforms — Ranked by Overall Score, Pricing, and Analyst Ratings (2026)
Detailed Reviews: Top 5 Enterprise CRM Platforms
1. Salesforce Sales Cloud — Best Overall Enterprise CRM
Salesforce has dominated enterprise CRM for over two decades, and 2026 is no exception. The platform’s Einstein AI suite, combined with the world’s largest CRM partner ecosystem (8,000+ apps on AppExchange), makes it the default choice for large organisations building a future-proof customer stack.
Standout 2026 Features: Einstein Copilot (conversational AI), Data Cloud (real-time customer data unification), Agentforce (autonomous AI agents), and Flow Orchestration for complex multi-step automation.
✅ Pros
❌ Cons
+ Best-in-class Einstein AI with generative capabilities + Largest partner/integration ecosystem globally + Highly scalable — from 50 to 500,000 users + Strong multi-cloud suite: Sales + Service + Marketing + Commerce + Gold standard support with Trailhead learning platform
– Highest total cost of ownership of any CRM – Steepest learning curve — often needs a dedicated Salesforce admin – Implementation timelines of 3–9 months for enterprise rollouts – Can become bloated without governance — licence creep is real – Pricing complexity: most features are add-ons at extra cost
Best for: Global enterprises with $1B+ revenue needing a full-suite CRM, AI automation, and a large partner ecosystem. Not ideal if budget is the primary constraint.
2. Microsoft Dynamics 365 — Best for Microsoft-Stack Organisations
Microsoft Dynamics 365 is the natural choice for enterprises already running Microsoft 365, Azure, Teams, and Power Platform. Its native integration with these tools eliminates the integration tax that Salesforce users pay and its Copilot AI — powered by OpenAI — delivers genuinely impressive productivity gains.
✅ Pros
❌ Cons
+ Native integration across Microsoft 365, Teams, Azure, Power BI + Copilot AI (GPT-powered) built into every module + Lower TCO vs Salesforce for Microsoft-heavy organisations + Power Apps and Power Automate extend CRM with no-code tools + Competitive starting price of $115/user/month for Sales Enterprise
– Weaker CRM-only product vs Salesforce outside Microsoft ecosystem – UI consistency issues between Dynamics modules – AppSource marketplace smaller than Salesforce AppExchange – Significant implementation complexity for non-Microsoft environments – Requires strong Microsoft partner for enterprise deployments
Best for: Enterprises running Microsoft 365/Azure seeking a fully integrated productivity + CRM stack with competitive licensing bundled into E5 agreements.
3. Oracle CX Cloud — Best for Data-Heavy Industries
Oracle CX Cloud excels where data depth and integration with Oracle’s broader technology stack — ERP, HCM, and supply chain — matter most. Finance, telecom, and utilities companies with complex pricing, entitlements, and billing needs frequently choose Oracle CX for its unmatched data model flexibility.
✅ Pros
❌ Cons
+ Unmatched integration with Oracle ERP (Fusion/NetSuite) + Strongest CPQ (Configure Price Quote) in the market + Deep data model for complex products, services and subscriptions + AI-powered Oracle Analytics built natively into the platform + Industry-specific clouds for financial services, manufacturing
– Steeper learning curve than Salesforce or HubSpot – Implementation typically takes 6–12 months for enterprise rollouts – Partner ecosystem smaller than Salesforce or Microsoft – UI modernisation is ongoing — some modules still feel dated – Less suitable for companies not using Oracle’s broader stack
Best for: Enterprises already on Oracle ERP or those in complex-product industries needing advanced CPQ and subscription billing within their CRM.
4. SAP CRM / C/4HANA — Best for Manufacturing & SAP ERP Users
For organisations running SAP S/4HANA or SAP ECC as their core ERP, SAP CRM delivers a level of native integration that no third-party CRM can match. The SAP Customer Experience suite — covering sales, service, marketing, commerce and CDP — connects directly to the ERP without middleware, reducing latency and data discrepancies.
✅ Pros
❌ Cons
+ Deepest native integration with SAP ERP — no middleware needed + Single data model for customer, product and order information + Strong in complex manufacturing, process industries and utilities + SAP Business Technology Platform (BTP) enables extensions + Roadmap tied to SAP RISE — cloud migration incentives available
– Highest implementation complexity and longest timelines (6–18 months) – UI/UX significantly behind Salesforce and HubSpot – Lower user satisfaction scores on G2 (7.4/10) vs competitors – Expensive to customise — requires specialised SAP consultants – Limited value for companies not already in the SAP ecosystem
Best for: Existing SAP ERP customers in manufacturing, process industries, or utilities needing a single data model for customer and operational data without integration layers.
5. HubSpot Enterprise — Best UX, Fastest ROI
HubSpot has fundamentally repositioned itself in the enterprise market. With HubSpot Enterprise — which includes Sales Hub, Marketing Hub, Service Hub, CMS Hub, and Operations Hub — large companies can run a fully integrated CRM stack with the best user experience on the market and implementation timelines of just one to three months.
✅ Pros
❌ Cons
+ Highest user satisfaction ratings — G2 score 8.8/10 + Fastest implementation: average 4-6 weeks for mid-enterprise teams + Breeze AI (generative) built into every hub at no extra cost + Best-in-class marketing automation + CRM in a single platform + Transparent pricing — no surprise add-on costs
– Not as deep as Salesforce for hyper-complex customisation needs – Weaker CPQ and service management for highly complex products – API rate limits can be restrictive for real-time enterprise scenarios – Less suitable for 10,000+ user global rollouts at maximum scale – Partner ecosystem smaller than Salesforce or Microsoft
Best for: Mid-to-large companies (50–5,000 users) that prioritise user adoption, marketing-sales alignment, and fast time-to-value over maximum configurability.
Feature Comparison: How the Top 5 Stack Up
The radar chart below visualises how the top 5 enterprise CRM platforms compare across eight critical capability dimensions. The scoring is based on analyst assessments, G2 user data, and our own product evaluations.
Figure 2: Enterprise CRM Feature Comparison Radar — AI, Customisation, Integrations, UX, Analytics and More (2026)
Feature
Salesforce
MS Dynamics
Oracle CX
SAP CRM
HubSpot Ent.
AI / Automation
✅ Einstein AI
✅ Copilot AI
✅ Oracle AI
✅ SAP AI
✅ Breeze AI
No-Code Builder
✅ Flow
✅ Power Apps
⚡ Partial
⚡ Partial
✅ Full
Marketing Automation
✅ Mktg Cloud
✅ Customer Ins
✅ Eloqua
✅ C/4HANA
✅ Marketing Hub
Customer Service Module
✅ Service Cloud
✅ Dynamics CS
✅ Oracle Svc
⚡ Partial
✅ Service Hub
E-commerce Integration
✅ Commerce Cld
✅ Dynamics Com
⚡ Partial
✅ Commerce
⚡ Via HubSpot
SAP / ERP Integration
⚡ 3rd party
✅ Native AX
✅ Oracle ERP
✅ Native
⚡ Connector
Mobile App Quality
⭐⭐⭐⭐½
⭐⭐⭐⭐
⭐⭐⭐½
⭐⭐⭐
⭐⭐⭐⭐⭐
Implementation Timeline
3-9 months
3-8 months
4-12 months
6-18 months
1-3 months
Customer Support
24/7 Premier+
24/7 w/ plan
24/7 Premier
24/7 Ent.
24/7 all tiers
Free Trial Available
30 days
30 days
30 days
❌ No
✅ Free tier
Table 2: Enterprise CRM Feature Comparison Matrix — Top 5 Platforms (✅ Full Support ⚡ Partial ❌ Not Available)
Price is only one part of the CRM total cost equation. Implementation, training, customisation, integrations, and ongoing admin costs can multiply the per-user licence price by a factor of 3–10x. The chart below compares starting enterprise licence costs alongside real user satisfaction scores from G2 and Gartner Peer Insights.
Figure 3: Enterprise CRM Pricing (per User/Month) and Customer Satisfaction Scores by Category — 2025
💰 TCO Warning: Salesforce enterprise deployments with integrations, customisations and premium support typically cost $2,000–$8,000 per user per year (total), not just the $165/user/month licence price. Always model the full 3-year TCO before signing.
How to Choose the Right Enterprise CRM: Decision Framework
There is no single best enterprise CRM — the right choice depends on your company’s existing technology ecosystem, industry, budget, and implementation capacity. Use this decision framework to narrow your shortlist:
Need fast ROI < 90 days → HubSpot or Freshsales Complex multi-country rollout → Salesforce or SAP
6. AI Capabilities
Leading AI: Salesforce Einstein > Dynamics Copilot > Oracle AI For NLP: Salesforce > HubSpot
7. Customisation
Maximum flex → Salesforce or Creatio Low/no-code → HubSpot Power Platform Open source → SugarCRM
8. Support Quality
Highest user-rated: HubSpot > Freshsales > Salesforce For 24/7 premium: all top 5 offer this
Table 3: Enterprise CRM Selection Framework — Match Platform to Your Company Profile
The 5 Questions to Ask Every CRM Vendor
Before signing any enterprise CRM contract, demand clear answers to these five questions:
What is the all-in implementation cost for our company size and complexity? (Not just licence fees)
What is the average go-live timeline for companies similar to ours, and what are the most common project delays?
What data migration support do you provide and how does it integrate with our existing ERP and data warehouse?
What is included in enterprise support and what additional premium support contracts are available (and at what cost)?
What are your AI roadmap commitments for the next 24 months and how are new AI features priced — included or add-on?
Enterprise CRM Trends to Watch in 2026–2027
The enterprise CRM market is undergoing the most significant transformation since the move to SaaS a decade ago. These are the trends reshaping purchasing decisions:
AI Agents (Agentic AI): Salesforce Agentforce and Microsoft Copilot Studio are pioneering autonomous AI agents that can autonomously complete multi-step CRM tasks — from qualifying leads to resolving service tickets — without human intervention.
Unified Customer Data Platforms: CRM vendors are acquiring or building native CDPs to unify real-time customer signals from CRM, web, mobile, and offline touchpoints. Salesforce Data Cloud and Adobe Real-Time CDP are leading this convergence.
Composable CRM Architecture: Large enterprises increasingly resist monolithic CRM suites in favour of best-of-breed point solutions connected via iPaaS middleware (MuleSoft, Boomi). This modular approach offers flexibility but increases integration complexity.
Vertical-Specific CRM Clouds: Vendors are launching industry-specific CRM products for healthcare (Salesforce Health Cloud), financial services (Salesforce Financial Services Cloud), automotive, energy, and manufacturing with pre-built data models and compliance features.
Outcome-Based Pricing: Some vendors are piloting usage-based and outcome-based pricing models, moving away from per-seat pricing — a trend that could reshape CRM cost structures by 2026.
Frequently Asked Questions (FAQ)
Frequently Asked Question
Expert Answer
Q1: What is the best enterprise CRM in 2026?
Salesforce leads overall for large enterprises. Microsoft Dynamics 365 is best for Microsoft-stack organisations. HubSpot Enterprise is top-rated for ease of use and customer satisfaction.
Q2: How much does enterprise CRM cost?
Enterprise CRM typically starts at $57–$165 per user per month for the base enterprise tier. Total cost including implementation, training and customisation can range from $50K to $5M+ depending on company size and complexity.
Q3: How long does enterprise CRM implementation take?
HubSpot: 1–3 months. Salesforce: 3–9 months. Oracle/SAP: 6–18 months. Timeline depends on data migration complexity, customisation requirements, and number of integrations.
Q4: Can I integrate CRM with SAP ERP?
Yes. SAP CRM integrates natively with SAP ERP. Salesforce offers pre-built SAP connectors and middleware. Microsoft Dynamics 365 connects via Azure Integration Services. Always validate your integration requirement before choosing a vendor.
Q5: Which CRM has the best AI features?
Salesforce Einstein AI leads with predictive lead scoring, automated insights and generative AI. Microsoft Dynamics Copilot is a strong runner-up, especially for Microsoft 365 users. HubSpot Breeze AI offers the easiest AI setup for non-technical teams.
Q6: Is Salesforce worth the high price for enterprise?
For enterprises with 1,000+ users needing deep customisation, multi-cloud integration and global support, yes — Salesforce delivers strong ROI. Mid-market companies may find HubSpot or Dynamics delivers better value at lower cost.
Table 4: Top CRM Questions Answered — Sourced from Real Buyer Research and Analyst Interviews
Conclusion: Which Enterprise CRM Should You Choose in 2026?
The enterprise CRM market in 2026 offers more capable, more AI-powered, and more specialised platforms than at any point in history. But greater choice also means greater complexity in the decision.
Our recommendation summary:
Choose Salesforce if: you need the most feature-complete, AI-advanced, globally scalable enterprise CRM and can invest the time and budget for a proper implementation.
Choose Microsoft Dynamics 365 if: your organisation is Microsoft-first and you want deep native integration with Teams, Azure, Power BI and Microsoft 365.
Choose Oracle CX Cloud if: you run Oracle ERP and need complex CPQ, subscription billing, or industry-specific data models in finance, telecom or utilities.
Choose SAP CRM if: you are an SAP ERP customer in manufacturing, process industries or utilities needing native ERP-CRM data integration.
Choose HubSpot Enterprise if: you prioritise user experience, fast deployment, high adoption rates, and transparent pricing over maximum customisability.